🏷️ Tech Stack: OPNsense • Wazuh • Zabbix • CrowdSec • Grafana • Teleport • Active Directory • GPO • HardenAD • PowerShell • Debian • Windows Server
Academic Project — Bachelor in Networks & Cybersecurity (2024)
📋 TL;DR - Executive Summary
Problem: Small and medium enterprises need comprehensive security monitoring and threat detection capabilities but can’t afford commercial SIEM solutions costing tens of thousands of euros annually. Most organizations lack the expertise to deploy enterprise-grade security infrastructure.
Solution: Complete open-source Security Operations Center (SOC) infrastructure using Wazuh (SIEM), Zabbix (monitoring), CrowdSec (threat response), and OPNsense (firewall) to provide enterprise-grade security capabilities at zero licensing cost. Implemented with segmented network architecture and automated threat response.
Technical Approach: Zone-based network segmentation with multi-layer detection (system monitoring + log analysis + behavioral detection), centralized intelligence dashboards, and realistic Windows/Linux hybrid environment representing real-world deployments.
Learning: Led Zabbix deployment and configuration as primary responsibility, gained hands-on experience integrating multiple security tools, and developed expertise in zero-trust network architecture.
Results: Fully operational production-ready security infrastructure with automated threat detection and response, comprehensive compliance monitoring (ISO 27001), and validated protection through penetration testing. Zero licensing costs with enterprise-grade capabilities.
Impact: Demonstrated that SMEs can implement sophisticated security monitoring and threat detection without expensive commercial solutions, creating a replicable blueprint for cost-effective enterprise security that protects critical business assets while maintaining operational efficiency.
🎯 Project Overview
Team: Matthieu PIGNOLET, Farhan DITTO, Neil MAHADALI, Jacob DUFOSSÉ
Duration: 8-week intensive project
My Role: Contributed to network segmentation design, Led Zabbix deployment and configuration, contributed to Wazuh and CrowdSec integration
Most organizations face a critical challenge: building comprehensive security monitoring and threat detection capabilities without breaking the budget. Commercial SIEM solutions and security orchestration platforms often cost tens of thousands of euros annually, making them inaccessible to smaller organizations that need security just as much as large enterprises.
Our mission was to demonstrate that open-source security and monitoring tools could provide enterprise-grade capabilities at a fraction of the cost. We built a complete Security Operations Center (SOC) infrastructure that monitors, detects, and responds to threats in real-time.
Important Note: While our security monitoring and detection stack is entirely open-source, we used Windows Server and Active Directory for realistic enterprise simulation. This means our solution is primarily open-source for the security components, with traditional Microsoft infrastructure representing the systems being protected.
🏗️ Business Challenge & Solution
The Security Monitoring Challenge
Organizations need comprehensive visibility into their IT infrastructure to detect threats, monitor system health, and maintain security compliance.
The challenge isn’t just about cost — it’s about finding tools that provide the depth of monitoring and threat detection needed to protect modern infrastructure while remaining practical to deploy and maintain.
Our Solution: Open-Source Security Stack
We designed a comprehensive monitoring and security solution using primarily open-source tools.
Architecture Philosophy:
- Segmented Network Design: Different security zones for different business functions
- Multi-Layer Detection: Combining system monitoring, log analysis, and behavioral detection
- Centralized Intelligence: Unified dashboards and alerting across all security tools
- Realistic Testing Environment: Windows/Linux hybrid infrastructure representing real-world deployments
Technology Mix:
- Open-Source Security Stack: Wazuh (SIEM), Zabbix (monitoring), CrowdSec (threat response), OPNsense (firewall)
- Traditional Infrastructure: Windows Server, Active Directory (representing protected systems)
- Modern Access Control: Teleport (open-source privileged access management)
🛡️ Network Infrastructure & VLAN Architecture
Switch Configuration & VLAN Segmentation
Our network segmentation relies on a managed switch implementing strict VLAN isolation:
VLAN Architecture: Our network is divided into four security zones, each isolated at Layer 2 level. Communication between zones follows strict allow-list policies defined at firewall rules level
| VLAN | Zone | Network | Business Function | Services | Security Level | Key Controls |
|---|---|---|---|---|---|---|
| VLAN 10 | SOC Zone | 10.81.110.0/24 | Monitoring & threat detection | SOC tools (Zabbix, Wazuh, Grafana) | High - Monitor everything | Monitor-only access |
| VLAN 20 | Services Zone | 10.81.120.0/24 | Core business systems (AD, files) | Internal services (AD, file server) | Critical - Protect assets | Authenticated access |
| VLAN 30 | Front Zone | 10.81.130.0/24 | Public-facing services | Public frontend (WordPress) | Medium - Controlled exposure | Controlled exposure |
| VLAN 40 | Bastion Zone | 10.81.140.0/24 | Administrative access | Bastion (Teleport gateway) | Maximum - Gateway control | Privileged access |
Switch Infrastructure: The managed switch ensures complete isolation between zones through dedicated configuration:
- VLAN Trunk: Configured to OPNsense for VLAN tagging
- Port Assignment: Dedicated switch ports per VLAN (e.g., ports 1-5 for SOC)
- Layer 2 Isolation: No direct inter-VLAN communication at switch level
Zone-Based Security Model
We implemented a zone-based architecture where each business function gets its own secured space with controlled access points. This approach ensures that security breaches in one zone cannot easily propagate to other critical areas of our infrastructure.
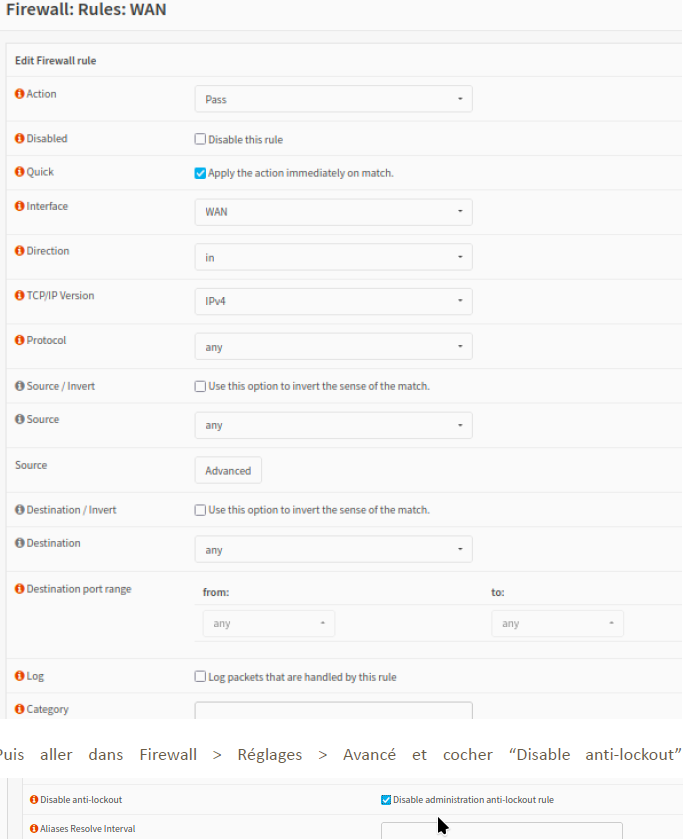
🛡️ OPNsense: Centralized Security & Routing
Interface Architecture & Routing
Our OPNsense firewall serves as the central hub for all network functions:
- WAN (10.81.1.x/24): External connectivity with controlled inbound access
- LAN (192.168.1.1/24): VLAN trunk termination and inter-VLAN routing
- INTERCO (10.81.150.1/24): Dedicated Teleport bastion connectivity
- ADMIN (10.81.255.1/24): Isolated administrative network
Centralized Services
Beyond routing, OPNsense manages all critical network services for our infrastructure:
DHCP Management: Automated IP assignment is handled centrally by OPNsense across all security zones:
SOC Zone (VLAN 10):      10.81.110.10 - 10.81.110.100
Services Zone (VLAN 20): 10.81.120.10 - 10.81.120.100
Front Zone (VLAN 30):    10.81.130.10 - 10.81.130.100
Bastion Zone (VLAN 40):  10.81.140.10 - 10.81.140.100
DHCP Options: VLAN-specific gateways (10.81.1xx.1) and DNS resolution managed by firewall
Multi-Layer Security: OPNsense provides comprehensive protection at multiple network layers:
- Network Firewall: Layer 3/4 filtering with granular inter-zone rules
- WAF Protection: Application-layer security for webserver-1 (SQL injection, XSS prevention)
- Integrated Threat Detection: OPNsense firewall rules dynamically working with CrowdSec and Wazuh for coordinated security
Zero Trust Traffic Policies
Our security model follows strict “deny by default” principles, where all inter-zone communication must be explicitly authorized:
Inter-Zone Rules: Each zone has carefully defined communication permissions based on operational requirements:
- WAN → Front: HTTP/HTTPS to webserver-1 only (through WAF)
- Front → SOC: Blocked (except webterm-1 log forwarding)
- SOC → Services: Monitoring tools communication only
- Bastion → All Zones: Administrative SSH/HTTPS access only
Core Communication Flows: The following essential services require cross-zone access for proper infrastructure operation:
- Administrative Access: All zones → Bastion via Teleport agents (TCP 443)
- Security Monitoring: All zones → Wazuh Manager (TCP 1514, 1515, 55000)
- Infrastructure Monitoring: All zones → Zabbix collector (TCP/UDP 10051)
- Authentication: All services → Active Directory (LDAP 389, Kerberos 88)
Security Rules Implementation
Detailed Network Flow Matrix
| Source | Destination | Protocol | Port(s) | Description |
|---|---|---|---|---|
| BASTION, FRONT, SERVICE, SOC | Active Directory | TCP/UDP | 389 (LDAP), 53 (DNS), 445 (MS DS), 135, 636, 88 | Required ports for Active Directory services |
| BASTION, FRONT, SERVICE, SOC | BASTION | TCP | 443 | Host connection for Teleport agents |
| BASTION, FRONT, SERVICE, SOC | Wazuh-Manager | TCP | 1515, 1514, 55000 | Wazuh agents access and RESTful API |
| BASTION, FRONT, SERVICE, SOC | Zabbix | TCP/UDP | 10051 | Access to Zabbix collector for agents |
| BASTION, FRONT, SERVICE, SOC | Firewall | TCP | 8080 | Used by CrowdSec |
| ADMIN | any | any | any | Admin network access to everything |
| BASTION | FRONT, SERVICE, SOC | TCP | 22 (SSH), 80 (HTTP), 443 (HTTPS) | Allow bastion to connect |
| SERVICE | 10.81.110.110 (Zabbix) | TCP | 80 (HTTP) | Grafana connection to Zabbix API |
| SOC | All networks | TCP/UDP | 10050 | Zabbix connection to agents for polling |
| Firewall (OPNsense) | Internet (WAN) | NAT | 80, 443, autres | External resource access |
Zone-Specific Services:
- SOC (VLAN 10): Wazuh stack, Zabbix monitoring, CrowdSec, Deming/Mercator compliance
- Services (VLAN 20): Active Directory with hardened GPOs, Grafana dashboards, secure file storage
- Front (VLAN 30): Docker containers, webserver-1 with WAF protection, reverse proxy
-
Architecture Philosophy: OPNsense provides unified security by ensuring all inter-zone traffic and HTTP requests are inspected and filtered according to zero trust principles, creating a single point of control for network and application-level security.
🔍 Intelligent Monitoring & Detection
The Digital Security Team
Our monitoring solution operates like having a team of specialized security analysts working 24/7, each with their own expertise and area of focus. Instead of relying on a single monitoring tool (which might miss certain types of threats), we deployed multiple complementary systems that work together to provide comprehensive security coverage.
Advanced Infrastructure Monitoring: Zabbix
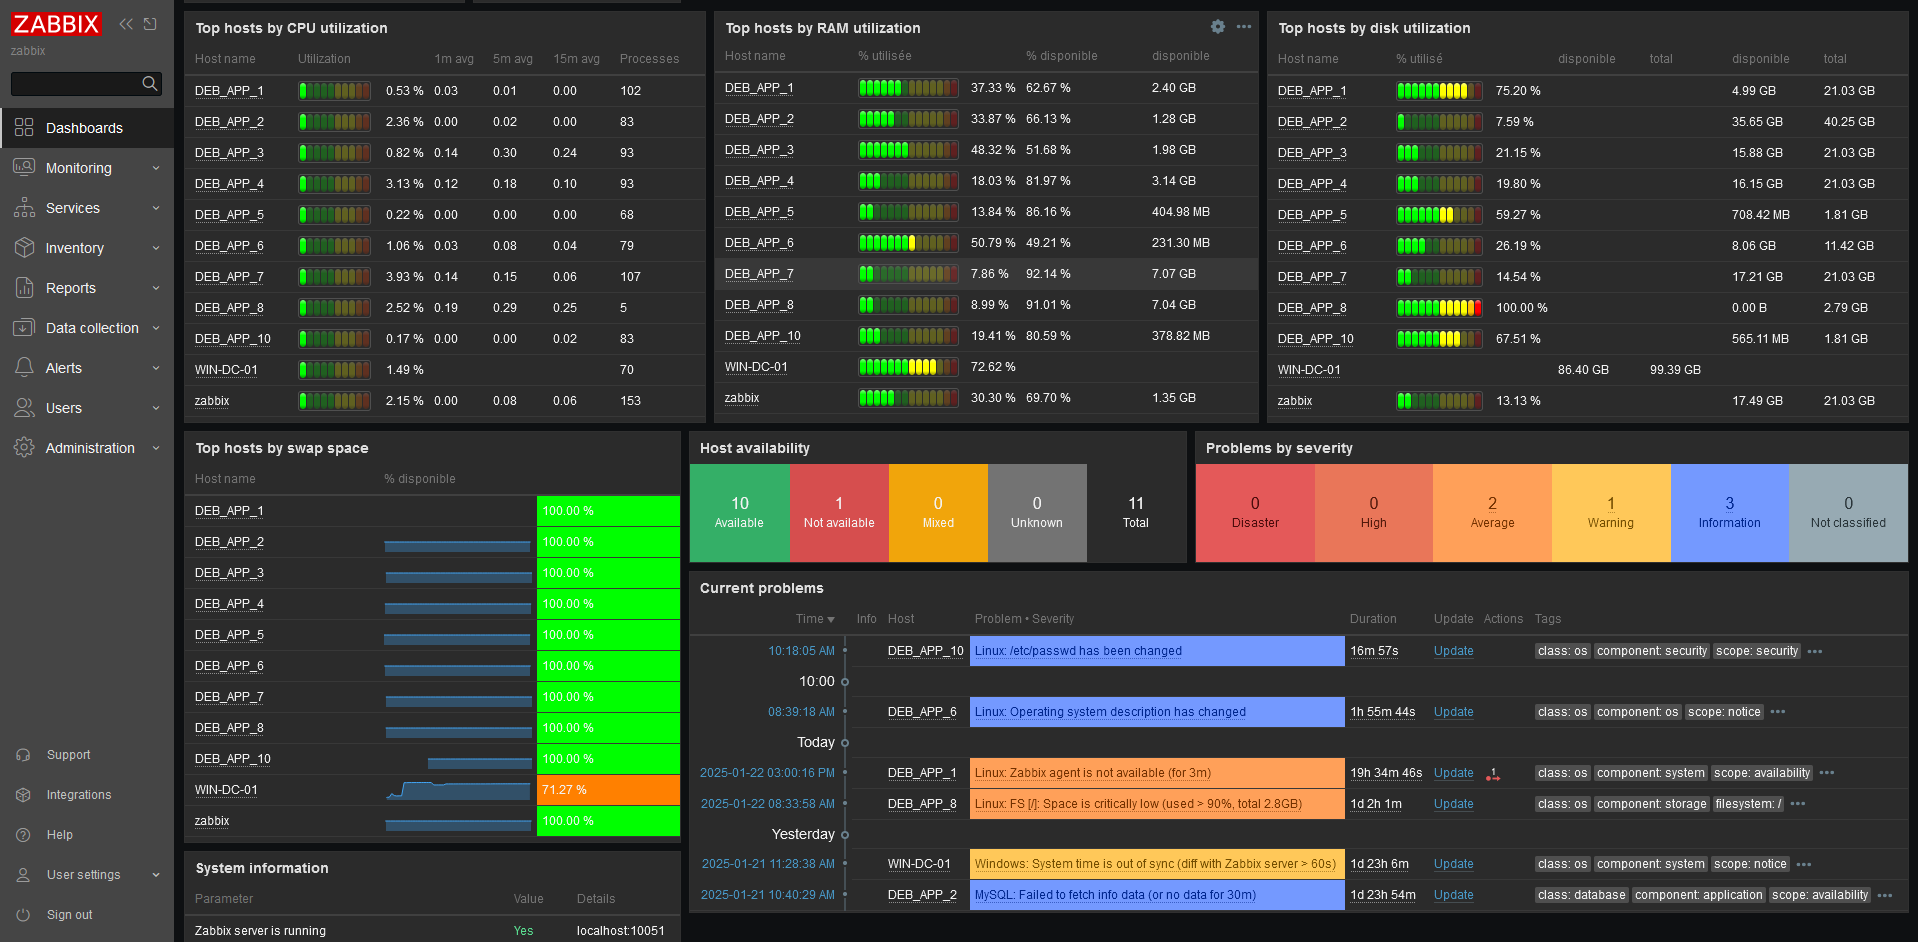
My Primary Responsibility: I led the complete Zabbix deployment, treating it as the “vital signs monitor” for our entire infrastructure.
Zabbix tracks the “heartbeat, temperature, and vital signs” of every system in our network. It doesn’t just tell us when something breaks; it warns us when systems are showing signs of stress or unusual behavior, thanks to its capacity to script precise alerting conditions that enable our SOC to detect issues before they impact operations.
Technical Implementation:
My deployment focused on creating a robust, distributed monitoring architecture:
- Centralized Monitoring Server: Dedicated Zabbix server (10.81.110.110) with optimized MariaDB backend (10.81.110.120)
- Agent Deployment: Secured monitoring across all Windows and Linux systems
- Encrypted Communications: TLS/PSK encryption protecting all monitoring traffic
- Identity Integration: LDAP/AD authentication for centralized access control
Real-Time System Monitoring:
Our Zabbix deployment continuously tracks critical infrastructure metrics:
• CPU utilization patterns and load averages
• RAM usage with swap correlation monitoring
• Disk space consumption and I/O performance
• Network interface traffic and error rates
• Service availability and response times
Business Value: Zabbix transformed our reactive approach (“something’s broken, let’s fix it”) into a proactive one (“this system is showing stress patterns, let’s investigate before it fails”). The custom dashboards I created provided instant visibility into infrastructure health, enabling our team to spot potential issues hours or days before they became critical problems.
Current Alerting Configuration:
We’ve implemented threshold-based alerting with customizable severity levels:
- Memory Alerts: RAM utilization > 90% over sustained periods
- CPU Monitoring: CPU usage > 80% with configurable time windows
- Disk Space: Critical alerts when disk usage exceeds defined thresholds
- Service Availability: Immediate alerts on service downtime
- Network Performance: Monitoring for unusual traffic patterns or interface errors
Intelligent Alert Management:
- Gmail Integration: SMTP-based email notifications with severity-based routing
- Escalation Logic: Alert progression based on problem persistence and criticality
- Consolidation: Unified problem view with severity classification (Warning → Critical)
Advanced Capabilities & Future Enhancements:
While our current setup uses proven threshold-based monitoring, Zabbix offers sophisticated conditional logic for complex scenarios:
Composite Condition Examples:
- (RAM > 85% AND Swap > 0%) = True memory pressure detection
- (CPU > 90% AND Load > 4) = Confirmed performance bottleneck
- (Network errors > threshold AND latency > 500ms) = Network degradation
- (Service down AND ping fails) = Confirmed service outage vs network issue
Advanced Monitoring Possibilities:
- File Integrity Monitoring: Detect changes to critical configuration files (/etc/passwd, system configs)
- Custom Script Execution: Automated health checks and custom metric collection
- Service Discovery: Automatic detection and monitoring of Windows/Linux services
SOC Integration Benefits:
- Cross-Platform Coverage: Comprehensive monitoring across our segmented VLAN infrastructure
- Predictive Analysis: Historical trend analysis enabling proactive capacity planning
- Security Correlation: Performance anomalies can indicate security incidents when correlated with Wazuh alerts
This monitoring foundation transforms our system into a more predictive infrastructure management, providing our SOC with essential visibility on system performance and security posture.

Security Event Analysis: Wazuh SIEM
Our Digital Forensics Laboratory
While Zabbix monitors system health, Wazuh serves as our digital forensics laboratory — collecting and analyzing security events from across our entire infrastructure to identify potential threats that traditional monitoring might miss.
Distributed SIEM Architecture
We implemented Wazuh using a three-tier distributed architecture for optimal performance:
Why this architecture? The distributed approach allows us to scale processing power independently. The Manager handles correlation logic, the Indexer provides fast search capabilities using OpenSearch, and the Dashboard gives our analysts a unified interface for investigation.
Multi-Layer Detection Engine
Wazuh collects system logs from all agents connected to each server, Windows security events from Active Directory, monitors critical files (system configurations), and analyzes user activities (connections, privilege escalations). This centralized collection feeds multiple detection engines working simultaneously:
Log Correlation & Behavioral Analysis Real-time analysis of logs from all servers and Active Directory to detect attack patterns. Example: failed SSH attempts across multiple servers → lateral movement alert.
File Integrity Monitoring (FIM)
Real-time monitoring of critical files (/etc/passwd, Windows Registry). When a file is modified, FIM identifies WHO did it, WHEN, and by WHICH process. This “who-data” capability provides detailed forensic intelligence.
Security Configuration Assessment (SCA) Automatic configuration checks against CIS (Center for Internet Security) requirements. Detects security drift and alerts on non-compliance (like weak password policies or misconfigured permissions).
Real-World Detection Example
Here’s what happens when someone modifies a critical system file:
↓ FIM detects the file change immediately
↓ Who-data identifies the user and process responsible
↓ Log analysis correlates with other suspicious activities
↓ Alert generated with complete context and timeline
The result? Wazuh tells us exactly WHO did WHAT, WHEN, and HOW — providing complete situational awareness rather than just basic log entries.
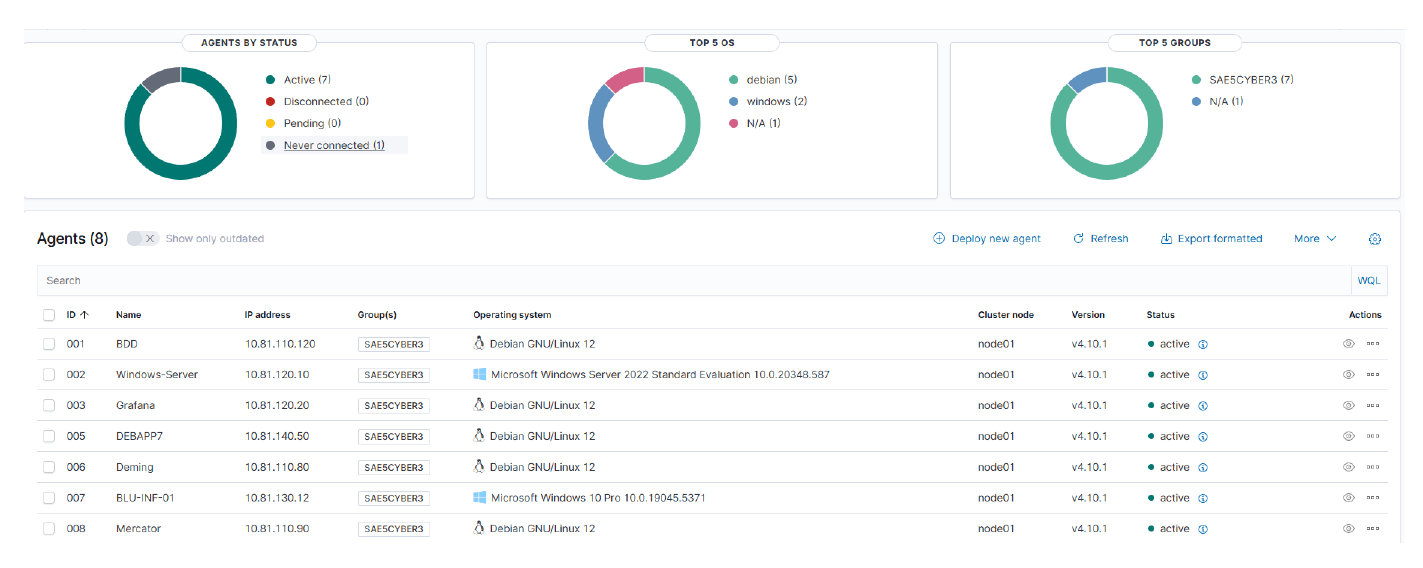
Current SOC Implementation
Our Wazuh deployment covers all critical zones with agents installed on every server. All security events flow back to our SOC zone for centralized analysis, and critical alerts automatically trigger email notifications to our security team.
Current Implementation in Our SOC:
- Agent Deployment: Wazuh agents installed on all critical systems (all VLANs)
- Centralized Collection: All security events aggregated to SOC zone
- Dashboard Integration: Security data feeds Grafana for unified visualization
- Alerting System: Critical events trigger immediate email notifications
- Compliance Monitoring: Continuous assessment against security frameworks
Wazuh Data Flow Architecture
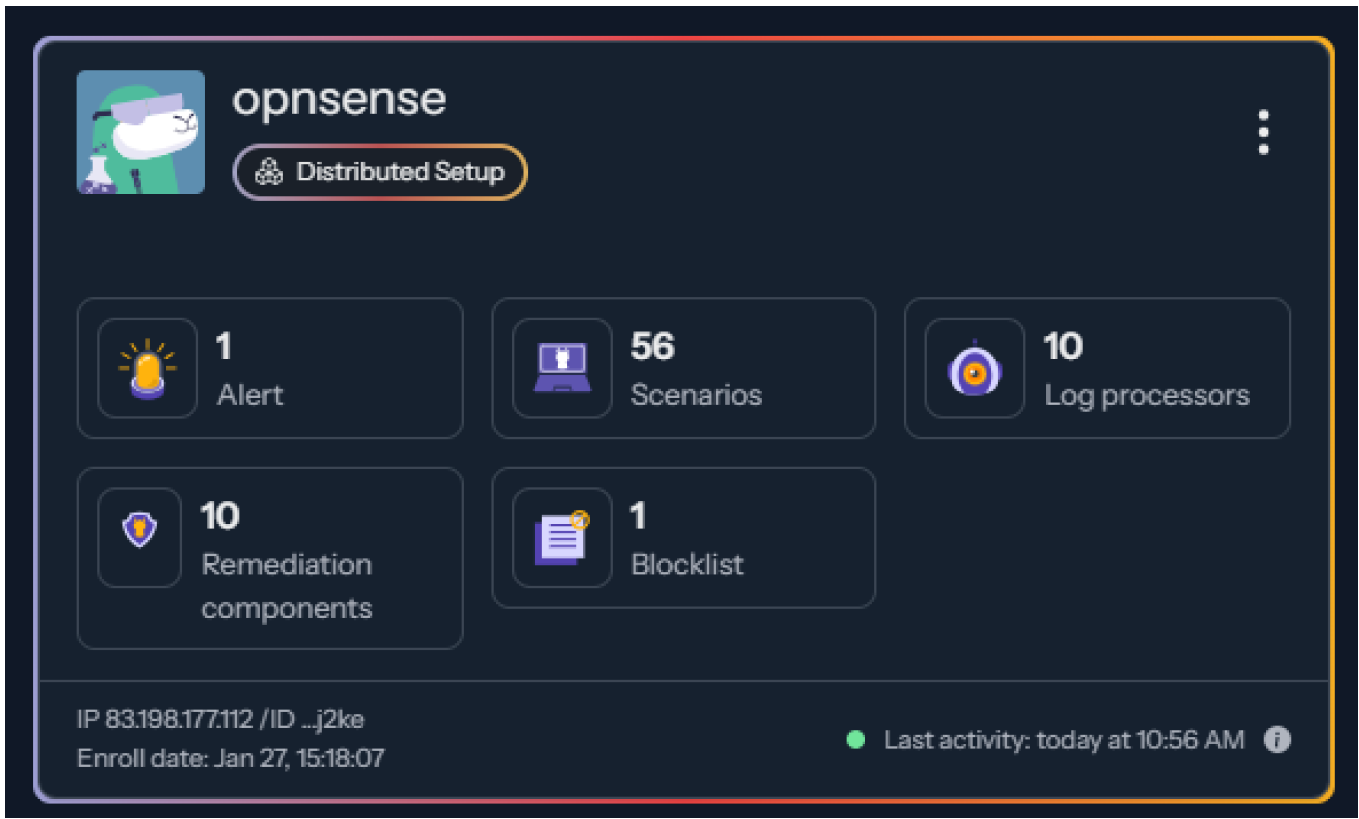
Adaptive Threat Response: CrowdSec Collaborative IPS
While Zabbix monitors our infrastructure’s vital signs, CrowdSec serves as the immune response system, automatically identifying and neutralizing threats through behavioral analysis.
Post-Connection Detection Architecture
CrowdSec analyzes application logs to identify malicious behavior patterns, unlike traditional IPS systems that inspect network traffic with static signatures. This behavioral approach detects attacks after connection establishment by analyzing the attacker’s actual actions.
Behavioral Detection vs Traditional Signatures
Traditional IPS systems analyze network traffic in real-time, requiring TLS decryption to inspect application-layer content for known attack signatures. CrowdSec instead analyzes application behavior patterns post-connection. For example, instead of looking for specific exploit code in decrypted traffic, it recognizes that “5 failed SSH login attempts in 60 seconds” indicates a brute force attack — regardless of which tools the attacker uses, and automatically blocks threats via bouncer integration (OPNsense). This log-based method operates after initial connection but provides rich application context and user attribution.
Operational Advantages:
- Simplified Deployment: No certificate management required for TLS decryption
- Reduced Resources: Post-connection processing less intensive than real-time inspection
- Enhanced Forensic Analysis: Detailed logs with application context and user attribution
Trade-offs:
- Response Time: Higher reaction time compared to network inspection as analysis occurs post-connection
Enterprise Profile-Based Recommendations
| Organization Type / Needs | Recommendation |
|---|---|
| Small SME exposed to Internet, no TLS decryption, limited budget | Wazuh + CrowdSec |
| Enterprise with SOC, security budget, NGFW firewall | NGFW/IPS with TLS inspection + Wazuh for host-based monitoring |
Distributed Agent Architecture in Our Infrastructure
How it works: The LAPI (Local API), running directly on OPNsense, receives decisions from agents and enforces them in security rules via the OPNsense bouncer. Blocked IPs are banned network-wide across all VLANs.
Current Implementation Flow
CrowdSec Security Engines (deployed on each server):
    ↓ Analyze local log files in real-time
    ↓ Apply behavioral scenarios (not static signatures)
    ↓ Generate blocking decisions based on behavior patterns
    ↓ Send decisions to Local API (LAPI) on OPNsense (TCP 8080)
    ↓ OPNsense implements network-wide IP blocking via firewall rules
    ↓ Share anonymized threat intelligence with global community
    ↓ Receive proactive protection from community blocklists with customizable trust levels
Example of Behavioral Detection Scenarios
- SSH brute force (5 failed attempts/60s → 4h block)
- Web scanning (20+ 404 errors/10min → 4h block)
- HTTP flooding (50+ requests/min → rate limiting)
- HTTP flooding (100+ requests/min → block)
Agent Deployment
CrowdSec agents monitor logs across all infrastructure zones: SSH/web/system logs on Linux servers, Windows Event Logs on AD servers, and firewall logs via OPNsense integration.
Hybrid Architecture: Suricata + CrowdSec + OPNsense
A combined approach would enable in-depth detection. With more time, we would have likely studied the solution of coupling CrowdSec (post-connection) with Suricata IPS/IDS (pre-connection) on OPNsense.
Advantages of This Combination:
| Component | Primary Role | Attack Detection Target |
|---|---|---|
| Suricata | Real-time network detection (signatures) | Pre-connection (exploits, C2) |
| CrowdSec | Behavioral post-connection detection (logs) | Post-connection (auth, scan, flood) |
| OPNsense | Firewall infrastructure + bouncer | Applies decisions via rules |
Note: This hybrid approach increases deployment complexity but provides comprehensive coverage across network and application layers.
Community Intelligence Integration
Global intelligence network provides collaborative defense. Our detections contribute to global threat intelligence while we receive protection from IPs flagged worldwide.
Community Intelligence Network Features:
- Global Blocklist: Access to curated database from 70,000+ active worldwide users
- Threat Sharing: Our local detections contribute to global threat intelligence
- Operational CTI: Intelligence sourced from actual production environments
Complementary Security Architecture: Two-Layer Defense
Why We Use Both Systems
The architecture implements both Wazuh and CrowdSec for complementary security functions:
Wazuh: Long-term log retention, compliance assessment, forensic analysis, and complex event correlation across multiple systems over extended timeframes.
CrowdSec: Real-time behavioral detection with automatic IP blocking via OPNsense bouncer integration, typically responding within seconds of threat identification.
Operational Workflow Example
Here’s how both systems work together during a typical attack:
SSH Brute Force Attack Timeline:
↓ CrowdSec Detection: Agent detects failed login pattern → Immediately blocks attacker IP via OPNsense
↓ Wazuh Analysis: Correlates SSH events with other system activities → Checks for any successful attempts → Generates detailed incident report
Result: Immediate attack prevention PLUS comprehensive security assessment.
Future Integration Possibilities
While both systems currently operate independently (providing valuable redundancy), future enhancements could include direct API integration where Wazuh’s detailed analysis could trigger enhanced CrowdSec blocking decisions, creating an even more responsive and intelligent defense system.
Current Architecture Benefits:
- Redundancy: If one system fails, the other continues protecting
- Specialization: Each system optimized for its specific role
- Performance: No dependencies between systems ensures reliable operation
This dual-layer approach provides both tactical threat prevention and strategic security intelligence, creating a robust defense that adapts to evolving threats while maintaining the detailed visibility needed for compliance and incident response.
🛡️ Strategic Security Governance: Deming / Mercator
(Implemented by team members - included for complete architecture overview)
Beyond Technical Monitoring
While technical monitoring catches immediate threats, we recognized that true security requires strategic oversight — understanding not just what attacks are happening, but how our overall security posture is evolving and improving over time.
Compliance & Risk Management: Deming
Deming functions as our security governance specialist — like having a compliance officer who continuously evaluates our security controls against international standards and helps us improve our security posture systematically.
Strategic Value:
- ISO 27001 Alignment: Continuous assessment of security controls against established standards
- Risk Tracking: Systematic identification and remediation of security gaps
- Compliance Documentation: Automated generation of audit-ready security assessments
- Continuous Improvement: Data-driven approach to security program enhancement
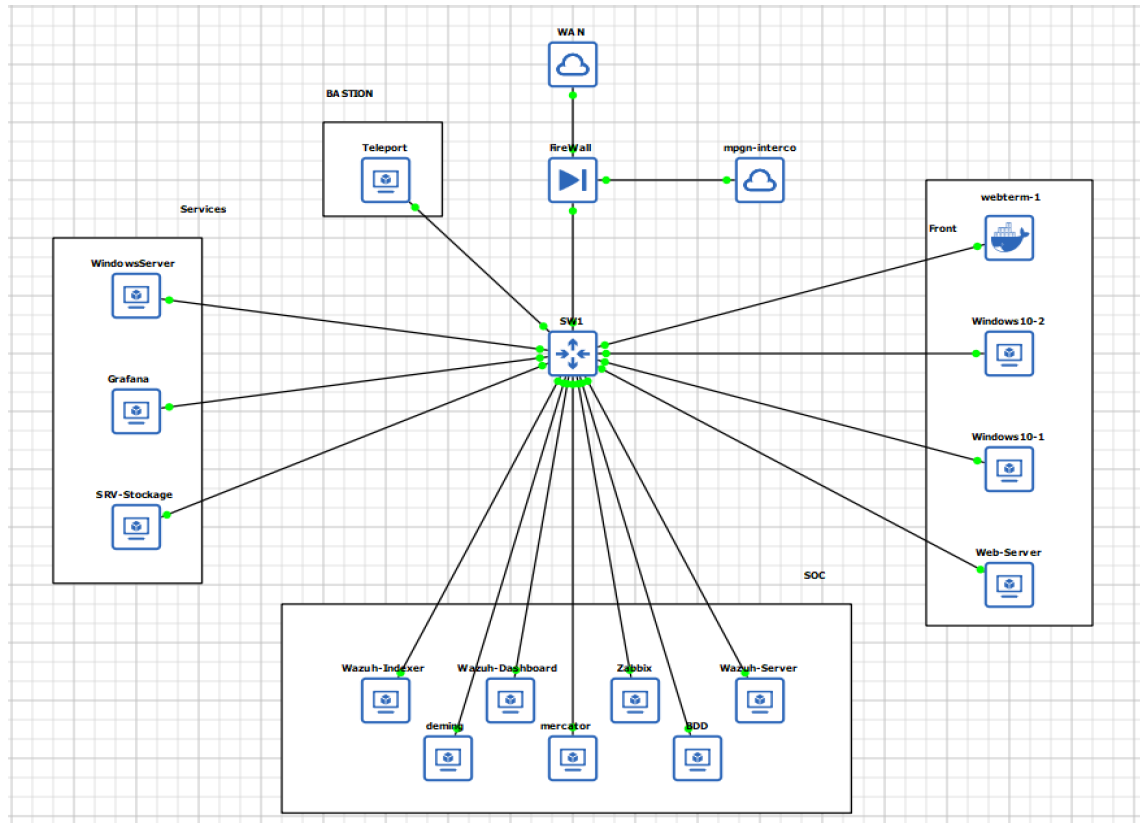
Infrastructure Mapping: Mercator
Mercator serves as our digital cartographer — providing clear visibility into our infrastructure’s structure, dependencies, and critical paths. Following ANSSI guidelines, it helps us understand not just what we’re protecting, but how our systems interconnect and where vulnerabilities might cascade.
Operational Benefits:
- Dependency Mapping: Understanding how system failures might impact business operations
- Risk Assessment: Identifying critical paths and single points of failure
- Change Management: Assessing the impact of infrastructure modifications
- Strategic Planning: Data-driven infrastructure evolution and security investment
Together, these governance tools ensure that our security program evolves from reactive incident response to proactive risk management and strategic security planning.
🔐 Identity & Access Management: Active Directory
(Implemented by team members - included for complete architecture overview)
The Foundation of Security
Our Active Directory implementation serves as the central nervous system for identity management, controlling not just who can access what, but how they can access it and under what circumstances.
Domain Architecture: BLUEWAVE.LAN
We built our domain like a well-organized company hierarchy, where each user’s access rights are determined by their business role and security clearance level. This isn’t just about convenience — it’s about implementing the principle of least privilege at an organizational scale.
Organizational Structure:
- Business Unit OUs: IT, Direction, Admins, Maintenance departments
- Role-Based Access: Different permissions based on job function and security clearance
- Tiered Administration: Separation of privileges to prevent privilege escalation attacks
Policy Enforcement Through GPOs
Our Group Policy Objects function like organizational rules that are automatically enforced across all systems.
Key Policy Controls:
- USB Device Control: Preventing data exfiltration through removable media
- Password Complexity: Enforcing strong authentication across all accounts
- Application Whitelisting: Controlling which software can execute on systems
- Session Management: Automatic logout and access time restrictions
Advanced Security Architecture
Tiering Model Implementation: Using HardenAD, we implemented a tiered administration model where administrative accounts are segregated based on the criticality of systems they manage. This prevents a compromise of one administrative account from cascading across the entire infrastructure.
AGDLP Model: Our privilege delegation follows the Account-Global-Domain Local-Permission model, ensuring that access rights are granted through properly structured groups rather than direct user assignments. This makes access management scalable and auditable.
Automation & Consistency: PowerShell scripts automate user creation and management, ensuring that security policies are consistently applied and reducing the risk of human error in account provisioning.
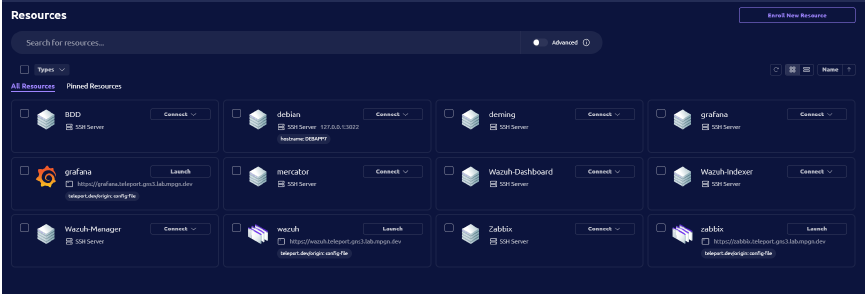
🚪 Secure Administrative Access: Teleport
(Implemented by team members - included for complete architecture overview)
The Bastion Approach
Rather than allowing administrators to connect directly to critical systems (which would be like having multiple keys to the vault), we implemented a centralized access control model using Teleport as our secure gateway.
Teleport: The Digital Gateway
Teleport transforms administrative access from a security risk into a controlled, auditable process. Every administrative session is authenticated, authorized, and recorded — creating a complete audit trail for security and compliance purposes.
Security Features:
- Multi-Factor Authentication: TOTP-based strong authentication for all admin access
- Session Recording: Complete video recordings of all administrative sessions
- Role-Based Access Control: Granular permissions based on job function and system criticality
- Protocol Agnostic: Seamless SSH and RDP access through a single web interface
Operational Benefits:
- Centralized Management: Single point of control for all administrative access
- Audit Compliance: Complete session logs for security audits and forensics
- Reduced Attack Surface: Elimination of direct administrative access paths
- User Experience: Simplified access process that doesn’t compromise security
This approach transforms administrative access from a potential security vulnerability into a controlled, monitored, and auditable business process.
🔬 Security Validation & Testing
(Implemented by team members - included for complete architecture overview)
Proving Our Defenses Work
Our testing methodology combined automated auditing tools with hands-on penetration testing to ensure our security controls were effective, not just theoretical.
Active Directory Security Assessment
We used PingCastle to perform comprehensive Active Directory security assessments, treating it like a security health checkup for our domain infrastructure.
Before and After Comparison:
- Initial Assessment: Identified weak delegation practices, legacy protocols, and insufficient access controls
- Post-Hardening Results: Demonstrated significant risk reduction through proper GPO implementation and tiering
- Continuous Monitoring: Regular assessments to ensure security posture doesn’t degrade over time
This approach proved that our security improvements delivered measurable risk reduction, not just theoretical compliance.
External Threat Simulation
WordPress Attack Surface: To validate our detection capabilities, we deliberately exposed a vulnerable WordPress server with known security weaknesses, creating a realistic attack target for testing our monitoring and response systems.
Attack Simulation Process:
- Reconnaissance: Nmap, Nikto, and WPScan to identify vulnerabilities
- Exploitation Attempts: Targeting discovered CVEs and configuration weaknesses
- Detection Validation: Confirming that our monitoring systems identified and responded to attacks
Key Findings:
- Wazuh successfully detected and categorized attack patterns
- CrowdSec automatically implemented IP blocking for malicious sources
- Zabbix identified system stress and unusual resource consumption
- Complete audit trail provided forensic evidence for all attack activities
This real-world testing proved that our integrated security stack didn’t just monitor systems — it actively defended them against actual attack techniques.
📊 Centralized Intelligence & Reporting: Grafana
(Implemented by team members - included for complete architecture overview)
Infrastructure Monitoring Visualization
Our Grafana implementation provides centralized visualization of infrastructure monitoring data, primarily focused on system health metrics collected by Zabbix.
- Real-Time Dashboards: Live visualization of system health metrics (CPU, RAM, disk, network)
- Cross-Zone Visibility: Unified view of performance across all VLANs (SOC, Services, Front, Bastion)
- Historical Trending: Time-series analysis of system performance patterns
Planned Multi-Source Integration
Future Enhancement: While we successfully implemented Zabbix-Grafana integration, time constraints and technical challenges prevented the completion of multi-source data correlation from Wazuh and CrowdSec. This unified security intelligence dashboard remains a planned evolution that would combine:
- Security Events: Wazuh SIEM alerts and threat detection data
- Threat Response: CrowdSec blocking decisions and community intelligence
- Infrastructure Health: Current Zabbix system monitoring (implemented)
- Compliance Status: Deming risk assessments and governance metrics
💡 Strategic Value & Cost-Effectiveness
This project demonstrates that comprehensive security monitoring and threat detection can be implemented affordably using primarily open-source tools. The security monitoring infrastructure (Wazuh, Zabbix, CrowdSec, OPNsense, Grafana) operates with zero licensing costs, making enterprise-grade security capabilities accessible to SMBs and budget-conscious organizations without compromising on functionality or security posture.
✅ Project Outcomes & Validation
Results
Our 8-week project successfully delivered a production-ready security infrastructure that meets enterprise security standards while using exclusively open-source tools.
| Objective | Result | Validation Method |
|---|---|---|
| Segmented Network Architecture | ✅ Implemented | Confirmed through penetration testing |
| Real-Time Threat Detection | ✅ Operational | Validated through simulated attacks |
| Identity Management & Hardening | ✅ Deployed | Verified through PingCastle audits |
| Secure Administrative Access | ✅ Functional | Tested through Teleport session recording |
| Centralized Monitoring & Alerting | ✅ Active | Confirmed through automated alert testing |
| Compliance & Governance | ✅ Documented | Validated through Deming assessments |
Key Achievement: Complete SOC infrastructure with automated threat detection and response, comprehensive compliance monitoring (ISO 27001), and validated protection through penetration testing — all achieved with minimal licensing costs.
🎓 Key Technical Competencies Developed
Primary Technical Leadership: Led Zabbix deployment and configuration including MariaDB backend optimization, agent deployment across all zones, and threshold-based alerting configuration.
Security Architecture & Integration: Implemented zone-based network design with VLAN segmentation, zero-trust access policies, and automated threat response mechanisms. Successfully integrated multiple security tools (Wazuh, Zabbix, CrowdSec, OPNsense) with proper authentication and communication flows.
Project & Documentation Management: Coordinated complex technical implementation across team members while creating comprehensive operational documentation suitable for security audits and knowledge transfer.
📎 Resources & Documentation
📄 Download Complete Project Report (PDF)
🔗 Open Source Tools Used:
- Zabbix - Infrastructure monitoring and alerting
- Wazuh - Security information and event management
- CrowdSec - Collaborative threat detection and response
- Teleport OSS - Secure infrastructure access
- OPNsense - Firewall and network security
- Grafana - Metrics visualization and dashboards
- Deming - ISO 27001 compliance management
- Mercator - Infrastructure mapping and governance